7. Debugger

Debugging mode is entered when a breakpoint is encountered or when the user launches the debugger by the popup menu or by pressing the F11 key. This will stop the emulation engine but the LCD is still refreshed.

Note: Debugger windows are preloaded at startup in order to display them quicker. The source code window may take a while to be displayed the first time: this is due to ROM call parsing.

TiEmu shows two debuggers simultaneously: a built-in assembly-level debugger, and the GDB/Insight-derived source-level debugger. These two debuggers have been adapted to interoperate seamlessly.

The assembly-level debugger is made-up of several frames:
- source code
- registers
- memory
- breakpoints
- PC trace
- stack
- heap (handles)

The source-level debugger is also made-up of several frames: These frames can be moved and/or resized (TiEmu saves/restores this with the configuration).
Frames are automatically refreshed when a change occurs from another frame.

Moreover, these frames can be controlled (maximize/minimize & show/hide) from the Windows menu of the source code window (considered as the main window).
You can also change the transient mode. When enabled, all of the TiEmu windows are grouped together as there was a single window.

7.1 Source code

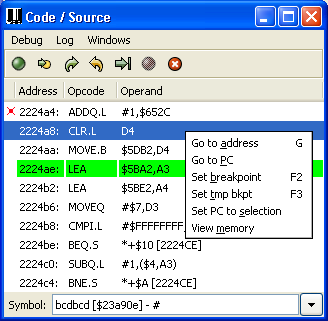
This frame is the main one:


You can browse the source code with the arrow and PageUp/Down keys. The green bar shows the current PC location. The blue one is the selection. The red cross is a breakpoint.

By right-clicking, you get the popup menu:
- go to address: enter the address to go,
- go to PC: jump to PC location,
- set breakpoint (F2): place a breakpoint at the selection. The bkpt frame is updated,
- set temporary breakpoint: place a breakpoint at the selection. This bkpt will be automatically removed when encountered.
- set PC to selection: load PC with the address at the selection,
- view memory: open a tab in the memory frame with the address at the selection.

The combo box lets you choose a ROM call by using the arrow. You can type it, too. It has automatic completion. Once selected, the view is updated to begin on the ROM call's address.

Debugging facilities provided are:
- run/break: start/stop emulation engine without closing frames,
- step in/out/over:
    step in equals to step by step
    step out runs PC until a RTS/RTR/RTD/RTE/STOP instruction is reached (go out of the sub-routine)
    step over runs PC until the instruction after the current one is reached (skips all code in a sub-routine for instance), except for branches.
    This works for JSR/BSR/FLINE/DBCC/TRAP,
- run to cursor: runs PC until the address under the cursor is reached.

Miscellaneous shortcuts:
- F6: (internal use) copy source code window content to C:\disasm.txt
- F1: set selection and PC to next line

7.2 Registers


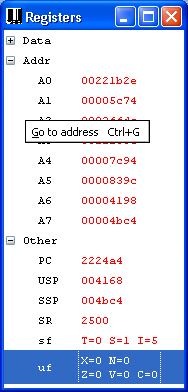
This frame displays all of the registers of the MC68000 processor. Take a look at the m68k user's manual if needed.

USP = User Stack Pointer (A7 in user mode, S=0).
SSP = System Stack Pointer (A7 is supervisor mode, S=1).
The active pointer is displayed in the stack frame.

SR is displayed in 2 modes: hexadecimal and single flags.

Each field is in-place editable.

By right-clicking on the address/data registers content, you will open a tab in the memory view at the adress contained in the register. Useful for browsing pointers and/or arrays.

If you double-click on sf/uf, you will be able to edit each flag:


7.3 Memory

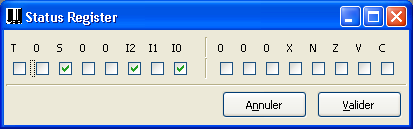
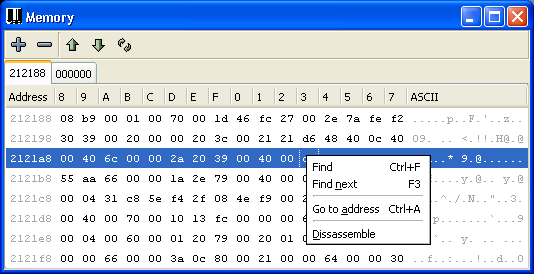
You can add/remove as many tabs as you want. Click on +/- to add_remove tabs.
Use the arrow keys or Page Up/Down keys to browse memory.

Each value can be edited in-place. Click the cell and you will be able to enter an hexadecimal string (like 12, 1234, 567890).

By right-clicking, you will get the popup menu:
- find / find next: opens a search dialog,
- go to address: lets you enter a hexadecimal address to go to,
- dis-assemble: updates the source frame at the selected address.
Note: The memory window may show aliases (ghosts) which does not really exist on the real calculator. For instance, RAM on the TI-89 Titanium exists at 0x00000-0x3ffff only but if you open a tab at 0x40000, you will see RAM content at 0x000000. So, be careful!

About the search dialog:


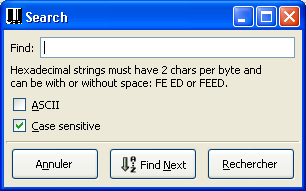
You can search for hexadecimal values or strings with or without case sensitivity (strings only).

Click the right button to start a search.
Click the middle button to find the next occurrence.

The occurrence is highlighted in green in the memory frame.

7.4 Breakpoints


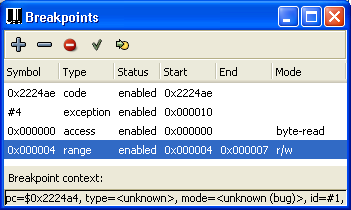
This frame lets you manage several kinds of breakpoints:
- code (added from the source frame)
- exception (traps, auto-ints, ...)
- data (access or range)
- program entry (the debugger is raised at the beginning of the program you have just launched).

Each breakpoint can be added or removed and enabled or disabled. You can go to the breakpoint location, too (last toolbar button).

7.5 PC trace

This frame shows the 10 latest PC values. Double-clicking the row will update the source frame with the address in the row.

7.6 Stack frame


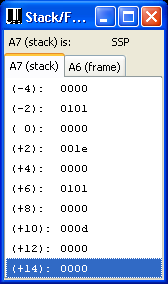
The 'A7 (stack) is' shows the current active stack pointer (user/supervisor).

The frame displays the stack pointer (A7) and the frame pointer (A6) used on the TI for function call and data storage.

Content is displayed as word values only. You can browse it by using the arrow or Page Up/Down keys.

7.7 Heap


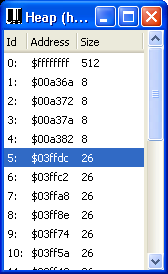
This frame displays all the handles the calculator has. It shows:
- handle number,
- address in memory,
- and size.

Double click the row to open a tab in the memory frame at the address pointed by the handle.

7.8 Source-Level Debugger