The Function Browser may be used to search for specific functions in the executable, allowing the user to easily browse through source code and set and clear breakpoints at anywhere in the executable with ease. Its powerful regular expression searches allow the user to easily set breakpoints on multiple functions at once.
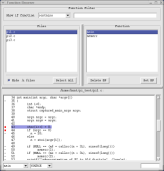
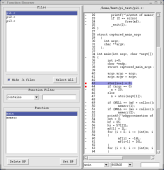
The Function Browser has two different layouts. Both layouts contain the same four sections; Files, Function Filter, Functions, and Source Display.
The Files section displays a list of all the source files. The files are read from the debug information in the program being debugged. To see the list of functions in a file, click on it. The function list should appear in the Functions Display and the source should appear in the Source Display. You can select multiple files by using the Control or Shift keys while clicking the left mouse button. When multiple files are selected, all the functions in those files are displayed in the Functions Display.
At the bottom of the Files Display, you should see a checkbutton labelled "Hide .h files" and a button labelled "Select All". Checking "Hide .h files" will remove all files ending in ".h" from the Files Display. Clicking "Select All" will select all files in the Files Display.
Above the Function Display you should see a section labelled "Function Filter". The purpose of this section is to apply a filter to the list of functions in the Functions Display. For example, if you click "Select All" in the Files Display, then many hundreds of functions could appear in the Functions Display. To see all functions containing the string "print", for example, click on the combobox in the Function Filter and select "contains". Then type "print" into the box to the right and hit the enter or return key. You should see the Function Display updated with a list of all functions containing "print".
Insight remember what the last filter you used was and will always open the Function Browser window with the last filter settings.
The Function Display contains the list of functions in the files that have been selected in the Files Display, after running them through any filter settings in the Filter Display. There are two buttons at the bottom of the display that allow you so set or delete breakpoints on every function in the Function Display in one operation.
For example, to set a breakpoint of every function name containing "print", follow the example in the Function Filter section to get a list of all functions containing "print". Then simply click the "Set BP" button.
The Source Display shows the source code for any file selected in the File Display. If a function is selected in the Function Display, the first line of that function containing executable code will be highlighted. If no source file is found, then the function will be displayed disassembled.
At the bottom of the window are two comboboxes and a text field. The combobox on the far left contains the function name or file location to display. Normally this is just output for your information, however you can type the name of any function into this box to see its source.
To the right of this is another combobox that allows you to toggle between source and assembly.
To the far right is an empty field. You can type a string in it and hit enter to search the current source file for any string.
In the source window itself, you can set breakpoints just like the source window.
If you click the right mouse button while over the File Browser, you should get a simple menu with three options; Toggle Layout, Help, and Close. Toggle Layout switches you between the two different Browser Window layouts. Choose the one you like best; Insight will remember it between sessions. Help pops up this help window. Close closes the Function Browser.